Wind smoothing
If you look at a chart showing wind generation more or less anywhere in the world where the readings shown are taken at frequent intervals, you will almost always see an irregular pattern of generation. This behaviour is often referred to as intermittency, but is probably more correctly referred to as variability.
If somebody wanted to persuade you that wind generation would solve your energy needs, this variability would seem to be a significant obstacle as it seems that the amount of wind generation available at any time varies hugely. This problem is further exacerbated by the fact that you cannot predict accurately how much wind there will be even over relatively short timescales. Even if you could forecast it, another disadvantage of wind is that you cannot control it. Even if you anticipate a period of low wind you are limited in what you can do to deal with it.
What is needed here is a way of effectively dealing with this variability. In GB at present it is primarily dealt with by the use of controllable sources of supply that are dispatchable, i.e. can be controlled. These include CCGT Gas. However, the main existing dispatchable sources are CO2 emitters, and one over-arching objective is to stop using them. So, what to do instead?
There are few options to deal with the problem by supplying the "missing" supply without using fossil fuels or huge amounts of storage.
So, the alternative approach preferred by many is to hide the problem, masking it with extremely deceptive charts and claims. Let's take a look at some examples on this page.
GB Grid wind generation 2021 : Daily
This chart shows the amount of electicity generated for the GB Grid for each day of 2021. As you can see the amount varies wildly.
There is a pattern of sorts in that you can see that there is generally more wind generation in winter, but there are plenty of days in winter when wind generation is low and many examples of high wind generation in summer.
The daily energy total varies from a minimum of 7.3GWh to a maximum of 328.2GWh. The highest daily total is about 45 times the lowest.
GB Grid wind generation 2021 : Weekly
The first step in masking this extreme variability is to show weekly totals.
When you plot weekly totals the extremes are reduced, and you can already see how many of the sharp changes have been significantly reduced or even removed.
The highest weekly total is under 9 times the lowest.
GB Grid wind generation 2021 : Monthly
Now plot monthly totals, and the main impression from the chart is the increased level of generation in winter, rather than the extreme variabiity.
It all starts to look a lot more routine and predictable.
The highest monthly total is only just over 3 times the lowest.
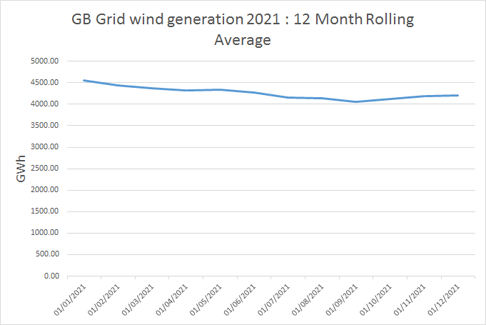
GB Grid wind generation 2021 : 12 Month rolling average
To really hide variabiity a rolling average is a great option.
The 12 month rolling average hides almost all variability, leaving only an amost subtle indication of seasonal variability.
For those hiding the truth of wind - job done!
(By the way, it's wise to be careful using rolling averages as they can show general upwards or downwards trends that you wouldn't necessarily want to draw attention to - as here.)
GB Grid wind generation 2021 : Half-hourly
Within each day wind generation can also vary hugely, and this makes the effect of wind's variability even more difficult to deal with.
In 2021 the maximum half-hourly recorded wind power to the GB Grid was 14.2GW, whilst the lowest was 58MW. The ratio of max to min was 244.
I have still seen no quantified proposal on how to deal with wind variability that takes account of the actual performance of GB wind in recent years.
The increased reliance on wind in GB is already locking us into continuing use of fossil fuels, particularly CCGT Gas.
The latest forecast from the National Grid ESO shows an increased use of gas in 2023 compared to previous forecasts, not the significant decrease we need.