Is Chris Martz relying on nobody bothering to check what he does?
Chris Martz describes this post (click to see the original) as a "science lecture".
Thousands liked it.
But I looked at it and thought "that can't be right".
Let me explain why there's little (if any) science involved, but A WHOLE HEAP OF DECEPTION.
That chart just cannot be right
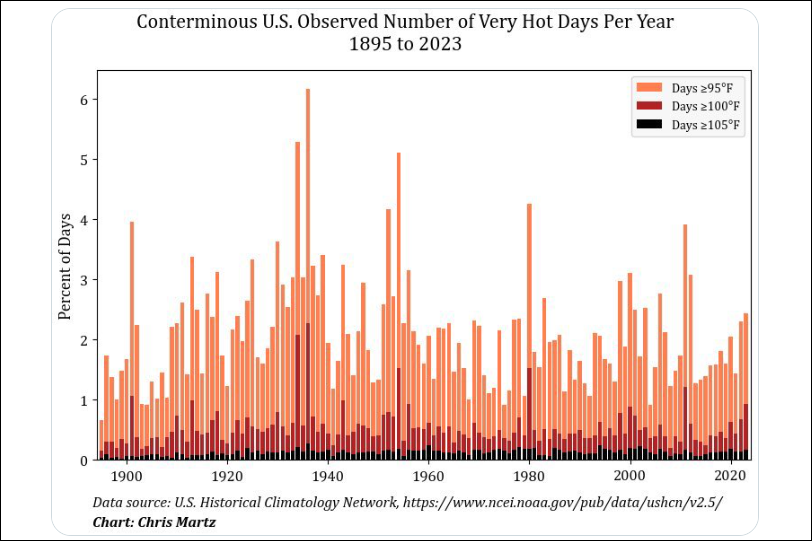
The chart seems reasonably self-explanatory.
But look at the vertical scale. It shows percentage of days in each year when selected thresholds were exceeded.
For all years percentages are in the low single digits. Looking at the bars for >=100°F there are usually less than 1% of days, i.e. mostly only 1 or 2 days per year when 100°F was exceeded.
What?
Even looking just at one station USC00042319 Death Valley - admittedly an extreme case - there are dozens of days in most years when 100°F is exceeded. There are various other stations in Arizona, California and even Utah where there are many days each year where 100°F is exceed.
Time to check the data source Chris Martz is using to see what's going on.
Where does Chris Martz get his data from?
Chris Martz provides this link to the data he has used.
However, that link is to USHCN monthly data, and there is nothing there to provide information about daily max temperatures.
This link must be wrong. There is NO DAILY MAXIMUM TEMPERATURE DATA THERE.
What is really happening?
The current source to use for daily data is GHCNd. Here's a link to its home page, from which it's posible to follow links to access the data using either http or ftp.
Although GHCNd provides daily data for over 100,000 stations worldwide. those include the 1218 USHCN stations.
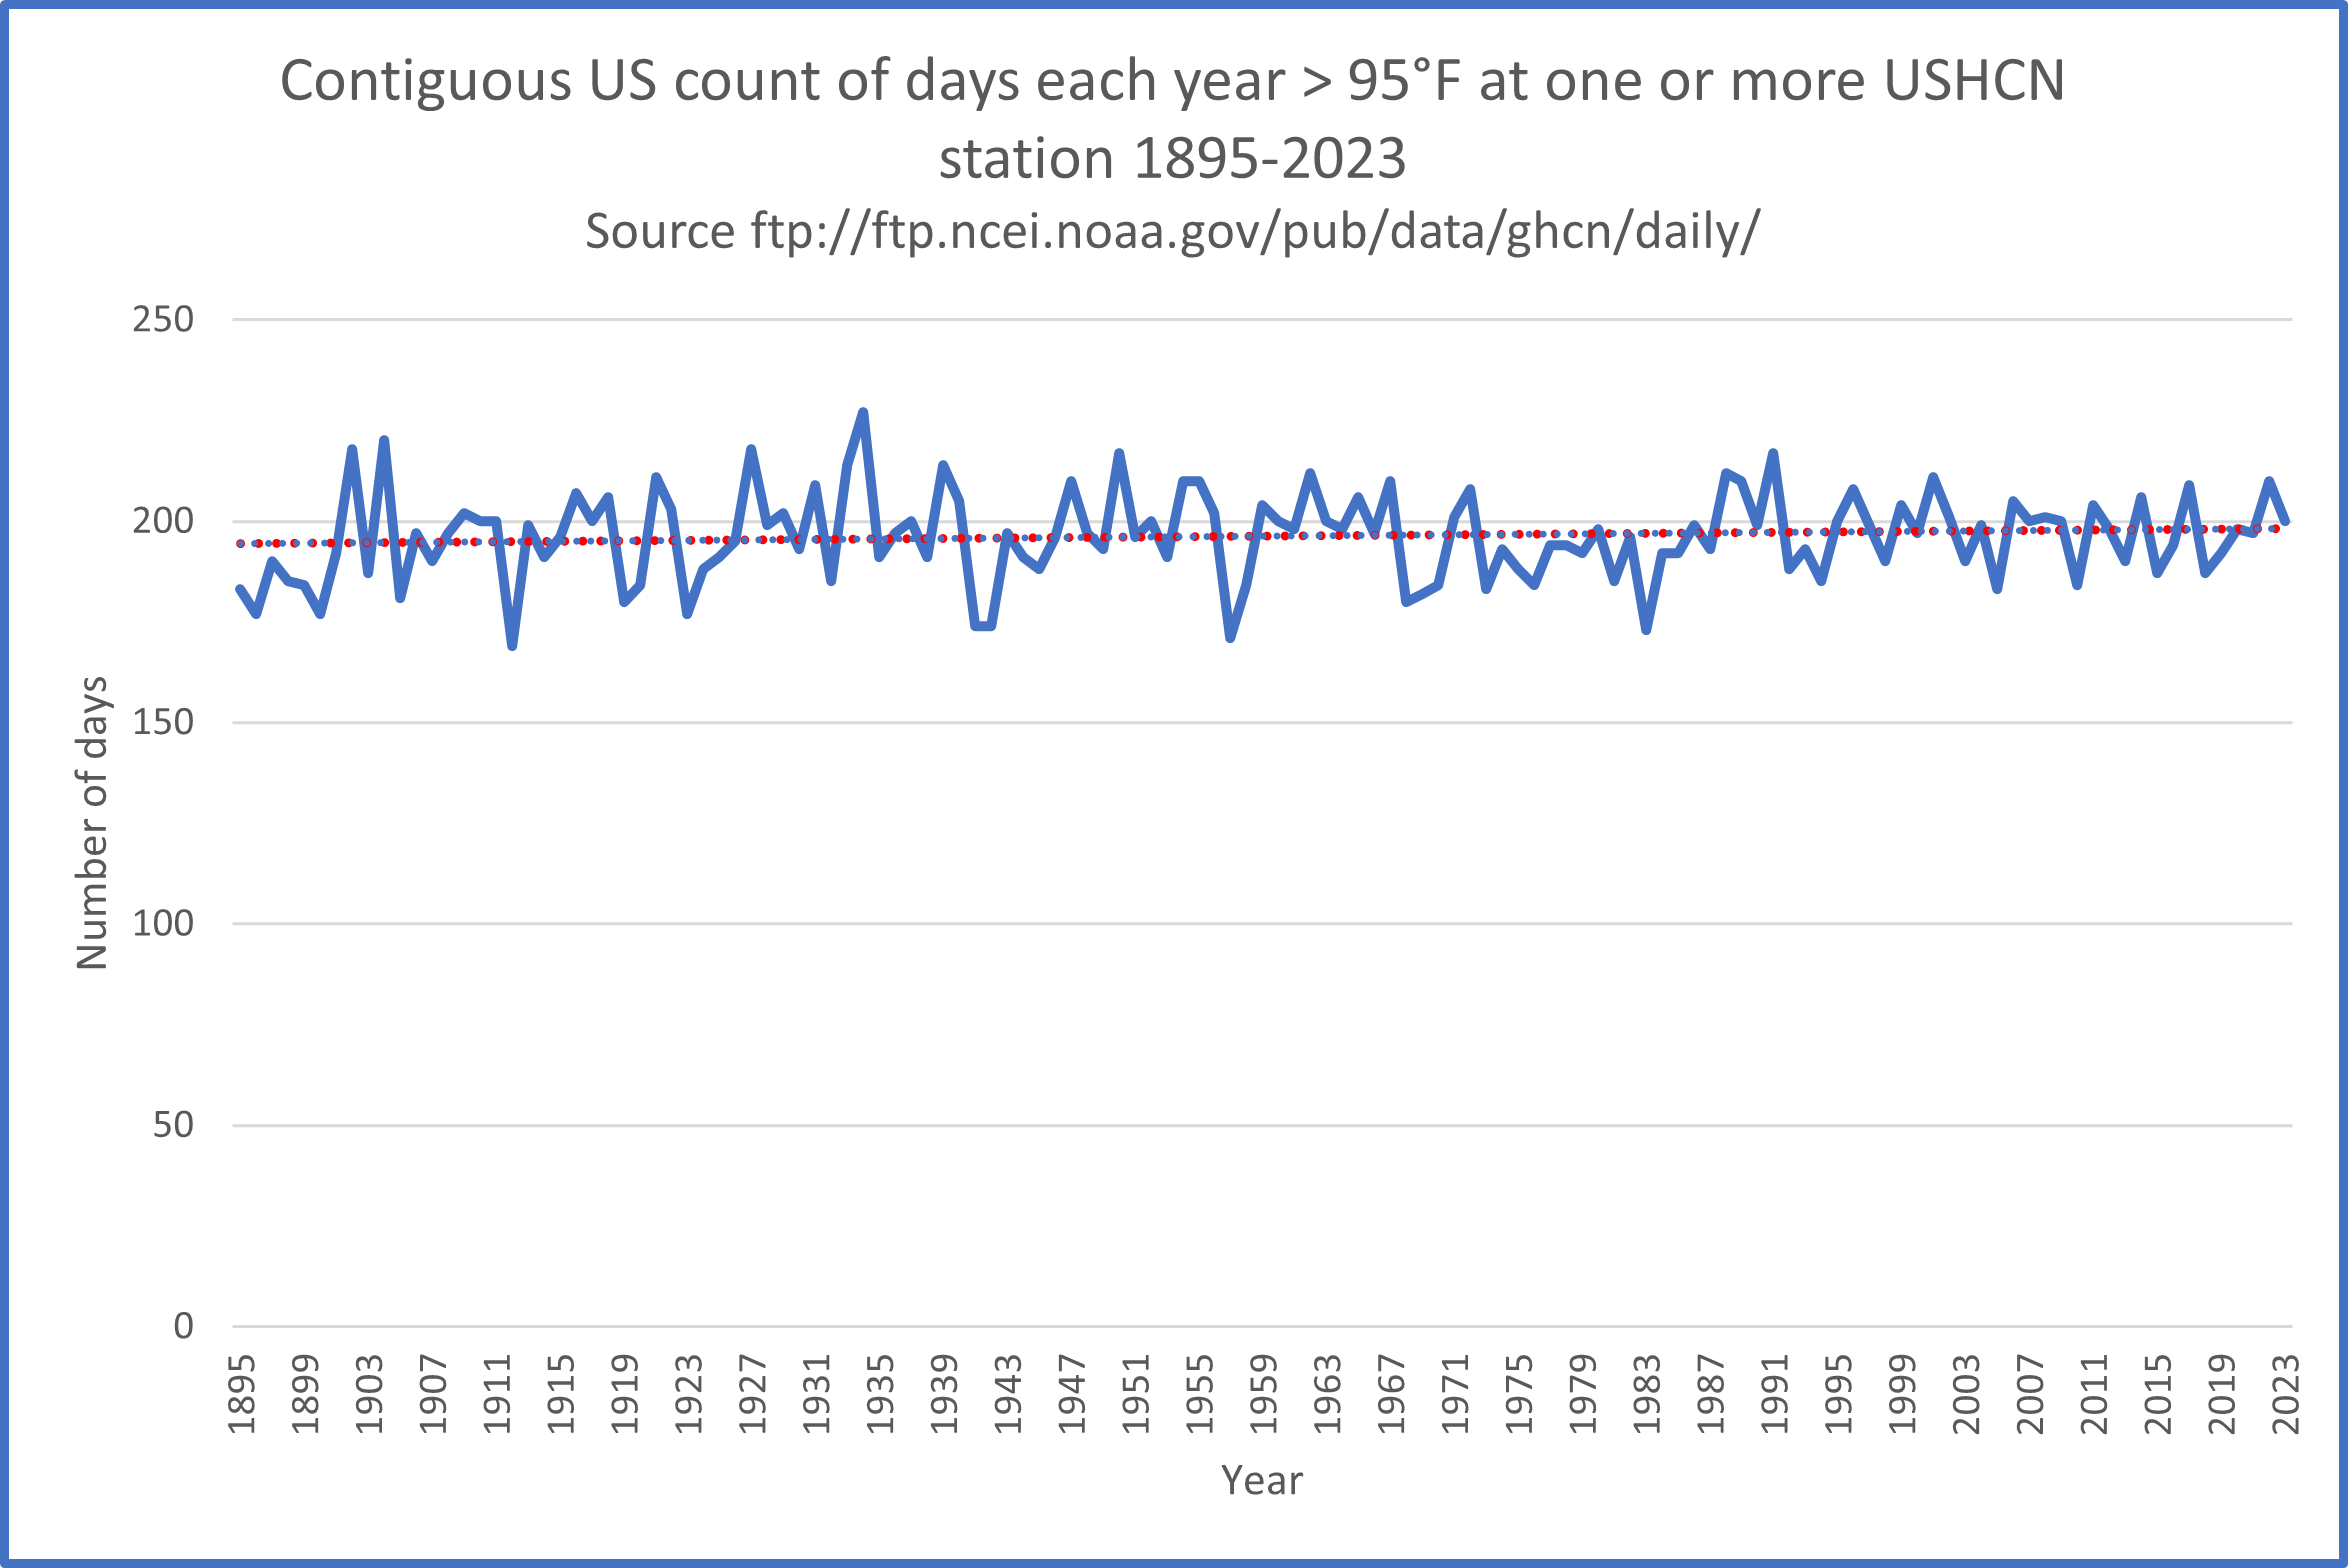
So, using GHCNd daily data for the USHCN station from 1895-2023 this chart shows the number of days each year on which 95°F was exceeded at any USHCN station.
Note that there was a relatively small "swell" in the 1930s and a slight "dip" towards the 1970s, but the trend line shows that the number of days above 95°F each year is increasing..
Are hotter and hotter days increasing?
Chris Martz says that hotter and hotter days are not increasing.
In fact, in his post he writes "The trend is down. You will not see this reported anywhere in the press. I guarantee it. The extremes don’t increase at the same rate that the background warming does. Extremes are a reflection of the bounds of natural variability. Trends don’t create extremes."
I'm not even going to try to work out what he's saying there, but here is the chart again, but with the number of days per year for 5 thresholds included.
Would you say that the occurrence of hotter days in the CONUS is increasing? I would. Look at the trend line on the >110°F line.
Chris Martz either doesn't understand the data and its implications, or he is deliberately trying to mislead people.